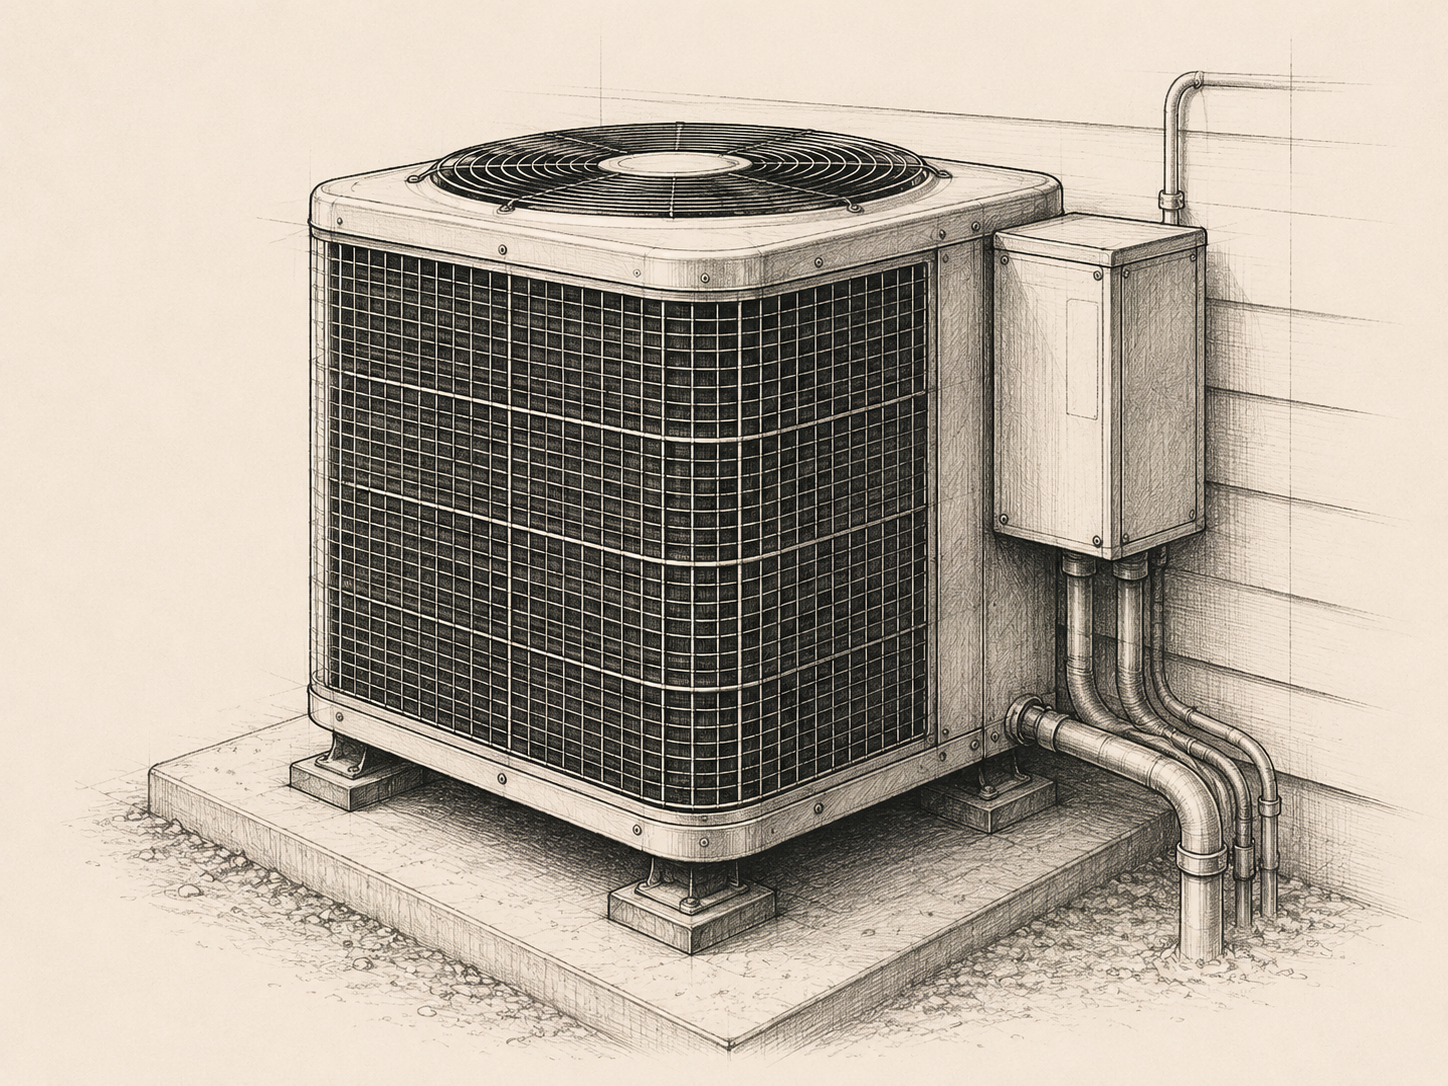
Service & Repair
Flat-rate, T&M, dispatch fees
Profit levers
- Billable efficiency
- Diagnostic fees
- Refrigerant & parts recovery
- Callback rate
Most HVAC shops run three businesses under one roof — install & replacement, service & repair, and maintenance agreements — reported as one blended P&L that hides which one is actually paying the light bill.
Dead Level rebuilds your books so each revenue stream stands on its own — with job costing, agreement-base economics, and a cash-flow view your bank will actually read.
Three revenue models · One shop
Flat-rate, T&M, dispatch fees
Profit levers
Fixed-price, financed jobs
Profit levers
Recurring, deferred revenue
Profit levers
Things we hear on the first call
"We sold 340 maintenance agreements last year. I don't actually know if we make money on them."
Root cause
Agreement revenue booked at sale; labor cost never allocated back over the agreement life.
"Every install crew looks profitable, until the callback truck rolls out the next week."
Root cause
Warranty and callback labor booked to overhead — not back to the original install.
"Refrigerant walks out of the shop and half of it never makes it onto a ticket."
Root cause
Refrigerant expensed at purchase, not consumed against the specific service call.
"Revenue is up 22% and cash is somehow tighter than last year."
Root cause
Financed installs paid over months; you funded the equipment and the install crew today.
"I raised flat-rate service pricing 10% and margin barely moved."
Root cause
Refrigerant, truck stock, and true burdened labor cost never reloaded into the price book.
"My install manager swears the change season crews were profitable. My P&L says something different."
Root cause
No crew-level job costing; labor lumped into a single install COGS bucket.
The cash view
Between financed installs, agreement deposits held for future work, and payroll that runs through the shoulder months — cash and profit don't move together in an HVAC shop.
13-Week Cash Forecast · Sample
Period ending 10/31
| Week | Service In | Install In | Payroll | Equip / PO | Net | Bank |
|---|---|---|---|---|---|---|
| W1 | $96K | $62K | $74K | $52K | $32K | $248K |
| W2 | $88K | $34K | $74K | $58K | ($10K) | $238K |
| W3 | $102K | $28K | $74K | $61K | ($5K) | $233K |
| W4 | $94K | $88K | $74K | $54K | $54K | $287K |
| W5 | $91K | $36K | $74K | $57K | ($4K) | $283K |
| 5-wk totals | $471K | $248K | $370K | $282K | $67K net | — |
For illustrative purposes only. Sample numbers are hypothetical and will vary based on your shop.
What you actually get
Every service call and install re-costed against labor hours, refrigerant, equipment, and burden — so target vs. actual is real and defensible.
Service, install, and maintenance agreements reported as three distinct income statements. One page each.
Flat-rate service pricing and install proposals recalculated on true burdened labor cost + equipment margin. No more guessing on quotes.
Rolling cash view that pulls from AR, financed installs, payroll, and equipment POs. Updated weekly.
Deferred revenue schedule, true cost-to-serve per visit, and renewal-rate impact on 12-month margin. Priced for reality, not for the sales pitch.
Wages + workers' comp + payroll tax + benefits + non-billable time = fully-loaded hourly cost. Loaded into every quote.
The numbers that matter
Below 50% means pricing or dispatch efficiency
After true labor burden and equipment — not before
Below this is a CSR or pricing problem
Every point below 80 kills future service revenue
Each callback wipes the margin on the next install
Your billing rate must clear this every hour
The operating rhythm
New service call, install contract, or agreement visit — all open a job in ServiceTitan / Housecall Pro / QBO with a matching cost code structure.
Payroll ties to timecards which tie to job numbers. No orphan hours. No 'shop' bucket eating margin.
Material used on the truck posts to the job — not the shop. You see real material margin as it happens.
Segmented P&L, KPI dashboard, and 13-week cash forecast in your inbox by day 7.
Which service lines to reprice, which install crews to promote, which agreement tiers to restructure, which financing plans to renegotiate.
This is for you if
This is not for you if
Questions HVAC owners ask
Most HVAC shops are fully onboarded in 2–4 weeks. That includes mapping your chart of accounts to service, install, and agreement lines, training your office on job-cost entry, and building the first clean month of reports.
Bring your last three months' P&L and balance sheet, plus your current payroll and job-management setup (ServiceTitan, Housecall Pro, FieldEdge, Successware). If your books are messy, that's fine — the call is designed to diagnose the mess, not judge it.
A 30-minute structured review with a Dead Level advisor who reads HVAC shop books every week. We look at your revenue mix, gross margins, cash cycle, agreement economics, and job-costing gaps. You leave with a written diagnosis and a clear next step — even if that next step isn't us.
Most owners see a clean, segmented P&L and owner dashboard within 30–45 days of starting. If your books need a deeper cleanup, we'll tell you upfront and handle the heavy lifting before the monthly rhythm begins.
Not necessarily. We handle the financial operating system, job costing, dashboards, and CFO-level guidance. Many clients keep their tax CPA and we coordinate with them. If you need a new bookkeeper, we can recommend one trained in our system.
Yes. We work with the tools you already use — QuickBooks, Xero, spreadsheets, or field-service software. The goal is clean numbers, not forcing you into a new platform. If a tool change would help, we'll flag it in the diagnostic.
The HVAC Financial Diagnostic
A structured 30-minute review with a Dead Level advisor who reads HVAC shop P&Ls every week. You leave with a written diagnosis. No pitch deck.